
What They Actually Show in Niche Group Travel Markets
Affinity travel has always been the quiet workhorse of the group travel business. While the industry chases the next viral destination, the operators and destinations who build durable revenue tend to be the ones serving travelers who already share something: a school, a sport, a table, a bloodline.
Affinity travel, strictly defined, means travel organized around a pre-existing group bond. Alumni associations, congregations, clubs, unions and family reunions. Interest-based niches like culinary and wellness are adjacent but distinct, since those travelers are assembled around a shared appetite rather than a shared membership. In practice, the two overlap constantly, and the planning skills transfer. This article covers both, with attention to where the money and the data backs it up.
The segments outlined below have anchored this market for decades. What has evolved is data and research evidence behind these anchors. These niche markets now have serious research behind them, and knowing where each market is pointing helps the industry better define opportunities.

Student Travel: Stability, Not Explosion
The story here is that the market found its floor. Student travel spent five years as a recovery narrative. That chapter has closed. The Student & Youth Travel Association’s Student Travel Business Barometer, produced with the research firm BONARD and drawing on 59 tour operators across nine countries, found roughly 848,000 students traveling domestically in its most recent full survey year. That was a 2% dip from the prior year and slightly under the forecast, but it landed at 104% of the record pre-pandemic 2019 volume.
The segment did not explode. It normalized above its old peak and then held. SYTA attributed the small decline to economic pressure on families and to schools shifting some budget toward alternative experiential programming, including extracurricular and immersive learning formats that compete with the traditional multi-day tour.
Stay connected to the people, places and trends shaping group travel. Subscribe to InSite from Leisure Group Travel.
For destinations, a stabilized market rewards different behavior than a recovering one. In recovery, capacity is the constraint and anyone with availability wins. In a stable market, share is taken from competitors, which means the destinations that win are the ones with a genuine curriculum hook, documented safety protocols, and a relationship with the teacher or the tour operator.
Student Travel by the Numbers
- Roughly 848,000 domestic student travelers in the most recent SYTA survey year, at 104% of the 2019 benchmark
- Survey base of 59 tour operators across nine countries, roughly 60-65% U.S.-based
- Family funding continues to carry the majority of trip cost, which ties this segment tightly to household discretionary spending
What This Means for Travel Planners
- Build itineraries around standards, not scenery. Teachers justify trips to administrators and parents through curriculum alignment. An operator that hands a teacher a ready-made standards itinerary removes the single biggest obstacle to getting a trip approved.
- Price transparency matters more than discounting. When families fund the trip, often with copious amounts of fundraising) a clear all-in number beats a low headline with surprise add-ons.
- Demand starts at the school level. The Barometer’s respondent base is tour operators because they aggregate the demand, but the trip has to be sold to teachers, parents and students before the dollars start flowing.
- Watch the alternative programming competition. Your competitor is not always another city, sometimes it is a robotics program that ate the travel line item. Stress the value of out-of-classroom, real life learning experiences.
Sports Tourism: The Segment Everyone’s Chasing
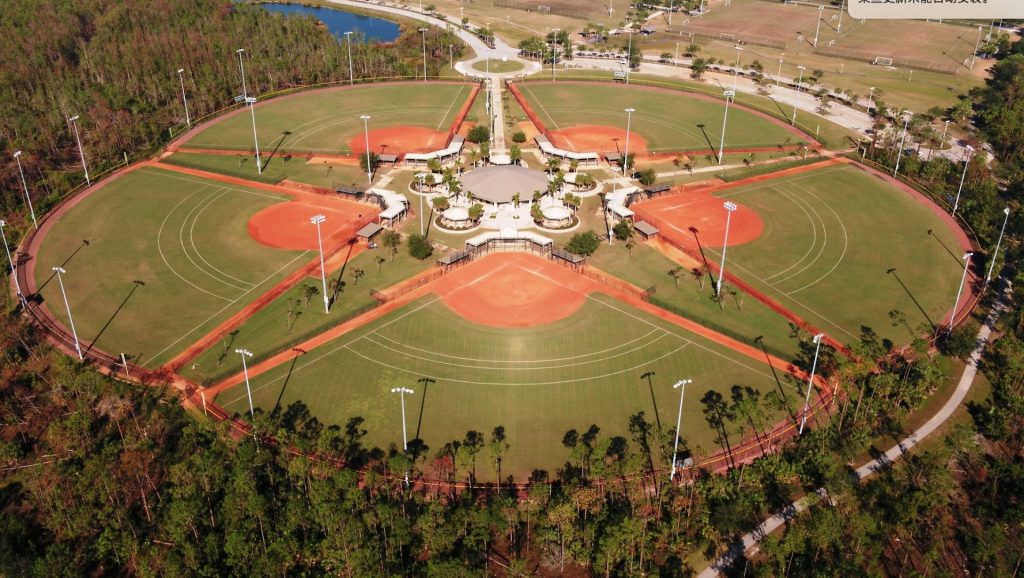
If you want a niche market with defensible economics, this is it. The Sports Events & Tourism Association released its 2026 State of the Industry Report at its April symposium, and it represents the first unified accounting of both participatory and spectator sports travel in the United States. The research was conducted by Tourism Economics.
The topline for 2025: sports tourism generated $111.2 billion in direct spending and $274.5 billion in total economic impact, supported 1.6 million jobs, and produced $20.5 billion in state and local tax revenue. Some 339 million sports travelers generated 124.3 million room nights.
The split inside that number is where the industry should focus. Participatory sports tourism, driven primarily by youth and amateur events, accounted for $60.1 billion in direct spending and $149.1 billion in total impact from 227.6 million travelers, supporting more than 880,000 jobs and $11.3 billion in state and local taxes. Spectator sports tourism, meaning fans traveling to watch a live sporting event, delivered $51.1 billion in direct spending and $125.4 billion in total impact from 111.4 million travelers.
The survey’s take-away is that kids in gyms and on turf fields out-earn professionals in stadiums. That has been the working assumption in the sports tourism trade for years, but it is now measured.
The report also captured international sports visitation to the U.S. for the first time, counting 3.6 million international travelers who came for sporting events in 2025 and generated $6.3 billion in direct spending, with international spectator volume up 3.4% year over year. With the United States hosting an extraordinary run of global events over the next several years, that baseline will grow.
Sports ETA identified Texas, Florida, California, Pennsylvania, Ohio, New York, Georgia, Illinois and North Carolina among the top-performing states, a list that reflects population scale and infrastructure depth more than pure spend.
Sports Tourism by the Numbers
- $274.5 billion in total economic impact from U.S. sports tourism in 2025
- $60.1 billion in direct spending from participatory events, against $51.1 billion from spectator events
- 6 million participatory travelers, roughly double the 111.4 million spectator travelers
- 3 million room nights across both segments
- 6 million international sports visitors generating $6.3 billion in direct spending
What This Means for The Travel Industry
- Room nights are still the currency. Total economic impact figures make good headlines and poor negotiating tools. When you approach a hotel partner or a city council, lead with the room-night number.
- Participatory demand is recurring; spectator demand is episodic. A regional tournament series that returns annually is worth more to a mid-market destination than a one-time marquee event.
- The international line is small but growing. Do not overbuild against it yet but watch whether it holds after the current global event cycle.
- Facility investment should be tested against participatory data and geo-location specifically, not against the combined $274.5 billion figure. The blended number flatters every proposal.
The latest in sports tourism destination news and facility reviews

Farmer’s Table welcomes a rotating lineup of
chefs and local farmers to dine with groups and
discuss the culinary process in a relaxed setting.
Culinary Travel: From Add-On to Identifiable
Food is no longer an amenity in the itinerary, it is the reason for it. The World Food Travel Association, which retired its State of the Industry report in favor of the annual Taste of Place Report, devoted its 2026 edition to the changing role of culinary heritage in tourism. Savvy destinations are moving away from selling restaurant lists and toward selling a distinct sense of place through agriculture, local food culture and heritage foodways.
That reframe has commercial teeth. WFTA’s research has long held that food and beverage activity delivers roughly a 25% added economic benefit to a destination, and that a majority of leisure travelers qualify as food travelers under its definition. Peer-reviewed work from WFTA researchers found that 79% of leisure travelers learn about local food and drink during a visit, which is a meaningfully different claim than saying they travel for it. Most travelers absorb a destination’s food identity whether or not they sought it out.
For group travel specifically, that is the opportunity. The culinary component does not have to carry the whole itinerary. It has to be authentic enough to become the thing the group remembers and repeats.
The competitive risk is homogenization. WFTA has been unusually blunt that as destinations chase the same trends, they begin to resemble each other, which erodes the exact differentiation that makes food travel work. A brewery district is not a differentiator when every mid-sized city has one.
Culinary Travel by the Numbers
- Food and beverage activity contributes roughly 25% added economic benefit to a destination, per WFTA
- 79% of leisure travelers learn about local food and drink during a trip
- The 2026 Taste of Place Report centers on culinary heritage as destination identity rather than on restaurant inventory
What This Means for Travel Planners
- Sell the local, not the trendy. The question is not whether you have good restaurants. It is whether you have something a group cannot easily get at home.
- Involve producers, not just chefs. Farms, fisheries, orchards and small manufacturers carry the heritage story that a restaurant menu compresses.
- Treat residents as an audience. WFTA argues local pride in culinary heritage is a precondition for selling it credibly to visitors.
- Verify age on any culinary statistic you cite. The consumer behavior data in wide circulation is older than most people assume.

Wellness Travel: The Spending Premium Is the Argument
Wellness tourism is the rare niche where the market size figure and the per-traveler figure both work in your favor. The Global Wellness Institute puts wellness tourism expenditures at $894 billion in 2024. For scale, GWI first measured the sector at $439 billion in 2012. The market roughly doubled in twelve years, and GWI’s 2025 Global Wellness Economy Monitor confirms that all eleven sectors of the wellness economy have now surpassed pre-pandemic levels.
The more actionable number is the premium. GWI’s analysis found international wellness tourists spending an average of $1,764 per trip, about 41% more than the typical tourist. The domestic premium was even steeper: wellness travelers spent roughly 175% more than the typical domestic tourist.
That premium is the entire business case, and it survives the objection that wellness travel is a small luxury niche. GWI distinguishes primary wellness travelers, whose trip is motivated by wellness, from secondary wellness travelers, who maintain wellness routines or add wellness experiences to a trip taken for another reason. The secondary group is far larger, and it is the one most group travel operators are already carrying without labeling it.
A destination does not just need a luxury spa to participate. It needs the components a secondary wellness traveler will use: walkable routes, credible healthy dining, access to natural features, and a hotel that does not make the fitness routine an obstacle course. GWI’s own position is that every destination has a distinctive wellness asset rooted in local geography, culture and tradition.
Wellness Tourism by the Numbers
- $894 billion in global wellness tourism expenditures in 2024, up from $439 billion in 2012
- International wellness travelers spend roughly 41% more per trip than typical international tourists
- Domestic wellness travelers spend roughly 175% more than typical domestic tourists
- All eleven wellness economy sectors have recovered past pre-pandemic levels
What This Means for The Travel Industry Planners
- Focus on the with yield, not just traveler volume. Wellness travelers are a spending argument, not a heads in beds argument.
- Build for the secondary traveler. Most of your wellness demand is already in your existing group pipeline.
- Use local assets rather than imported formats. Mineral springs, forest, coastline, agricultural tradition and indigenous practice differentiate. A generic yoga session does not.
- Wellness helps with seasonality. Off-season positioning around rest, nature and restoration is a legitimate use of shoulder capacity.
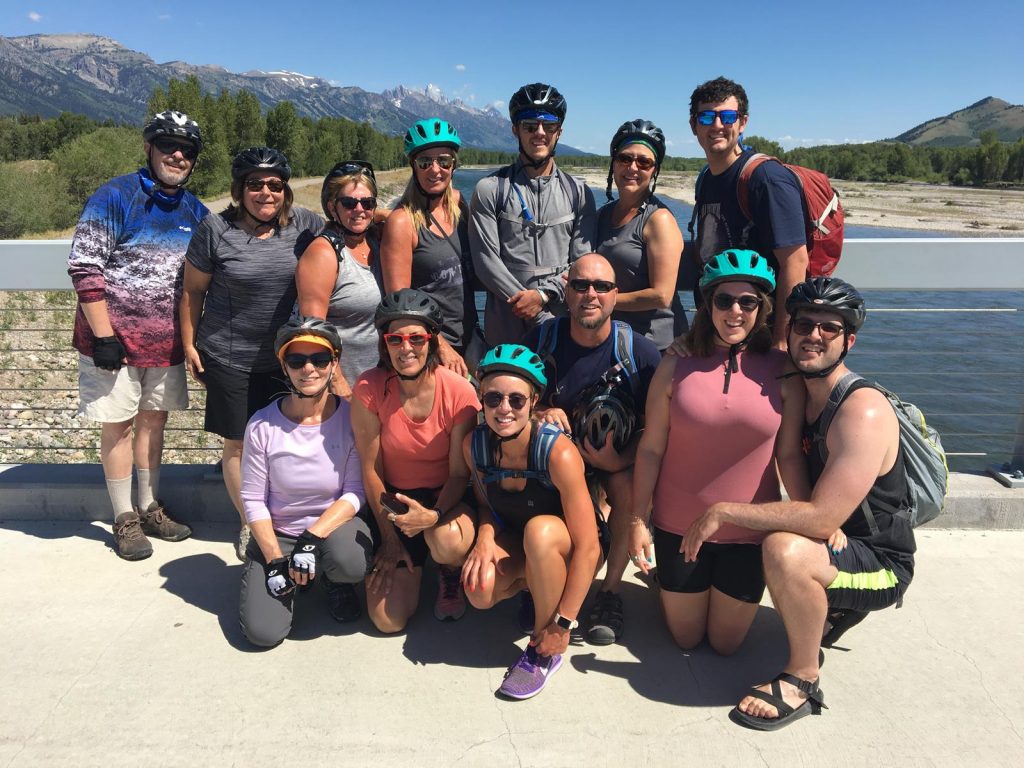
Tour operators are seeing strong growth in family small group tour bookings. Photo Credit: Austin Adventures
Multigenerational and Reunion Travel: The Original Affinity Market
If affinity travel means a group bound by something that existed before the trip, this is the purest form of it. Nobody assembles a family. It is already assembled, it already has a decision-maker, and it already has a reason to gather.
The evidence base here has improved substantially over the years. The Family Travel Association, working with the NYU School of Professional Studies Jonathan M. Tisch Center of Hospitality and Good Housekeeping, released the 10th anniversary edition of its U.S. Family Travel Survey in October, polling nearly 1,600 U.S. parents and grandparents.
The headline numbers are eye-popping. Ninety-two percent of parents said they plan to travel with their children in the coming year, the highest level the survey has recorded since before the pandemic. The comparison that gives it weight is the 2019 edition, when only 70% called themselves likely or very likely to travel with their children over a three-year horizon. Something has changed structurally.
Inside that, the group business is where the growth is. Fifty-seven percent of parents said they are planning a multigenerational trip involving grandparents and children, up two points from 2023. Extended family travel with cousins, aunts and uncles was planned by 48%, a seven-point jump over the same period. On the other side of the survey, 71% of grandparents reported having taken a multigenerational trip recently, and 57% said they plan another.
Now the number that should change how destinations sell to this segment: 37% of grandparents reported fully funding the multigenerational trip, and 84% pay for skip-generational travel, meaning trips where grandparents take the grandchildren without the parents. Skip-generational travel held steady at 11% of the mix.
That funding split has a direct marketing consequence that most destinations get wrong. The traveler you are photographing is a child. The person writing the check is often 65 and researching on a desktop. FTA found grandparents skewing toward official destination websites and established review platforms, and showing markedly lower engagement with AI planning tools than parents, whose own AI usage sat at just 27%. Credibility and searchability still carry this segment. Parents leaned on search engines at 81%, review sites at 77% and direct merchant websites at 74%.
The format news is good for domestic destinations. Multi-day trips within the United States accounted for 73% of the multigenerational trips being planned, making this a drive-market and regional-airport story rather than an international one.
One more finding deserves attention. Roughly 13% of families surveyed include a child with special needs. Those families travel more frequently and spend more than average, and they graded the travel industry a C-minus on inclusivity. That is an underserved segment with above-average yield telling the industry directly that the product does not work for them.
Multi-Generational Travel by the Numbers
- 92% of parents plan to travel with their children in the coming year, against 70% describing themselves as likely to in the 2019 edition
- 57% of parents planning a multigenerational trip, up 2 points from 2023; 48% planning extended family travel, up 7 points
- 71% of grandparents have taken a multigenerational trip recently; 57% plan another
- 37% of grandparents fully fund the multigenerational trip; 84% fund skip-generational travel
- 73% of planned multigenerational trips are multi-day domestic
- 50% book lodging with a kitchen; 46% limit paid attractions
- 13% of families include a child with special needs, and grade the industry a C-minus on inclusivity
What This Means for Travel Planners
- Market to two buyers with one message. The grandparent funds it and the child influences it. Marketing copy written only for parents misses both ends of the transaction.
- Sell the room configuration. Connected rooms, suites and rental units with kitchens are the operational bottleneck in this segment. Destinations that can inventory that capacity have a real advantage.
- Age-span programming beats headline attractions. An activity that works for a four-year-old and a seventy-eight-year-old simultaneously is scarce and worth promoting explicitly.
- Free and low-cost assets have become a key selling point. Parks, waterfronts, walkable downtowns and public festivals directly answer the 46% limiting paid attractions.
- Accessibility is a revenue opportunity, not a compliance line item. The families rating the industry a C-minus travel more and spend more than average.
- Reunions are recurring and plannable. Unlike most niche demand, a family reunion often has a fixed cadence and a named organizer. That is a relationship a destination can own for years.
Five Niche Travel Markets, Five Different Evidentiary Positions
Sports tourism has the strongest research infrastructure in the group travel world right now, with a unified national study and a clear participatory-versus-spectator split. Multigenerational and reunion travel has a decade-long annual survey behind it and, crucially, data on who actually pays. Wellness has a credible global measurement framework and a documented spending premium. Student travel has an association-backed annual barometer showing a market that has stabilized above its old peak. Culinary has a serious annual report and a strategic reframe toward heritage, though its consumer behavior data is aging.
The practical takeaway is not which niche to chase. It is that the evidence, backed by spending patterns varies enormously across these markets, and the destinations and operators who understand that difference make better capital and marketing decisions.
Affinity and niche travelers are not looking for a destination. They are looking for a destination that already understands what they came for. The research exists to tell you which of those groups is worth building for. Use it, and check where it came from.
More group travel ideas, delivered weekly. Subscribe to InSite from Leisure Group Travel.